Data-driven Decisions Made Easier
Obtain a multilingual analysis of brand interactions, consumer
sentiment toward your brand.
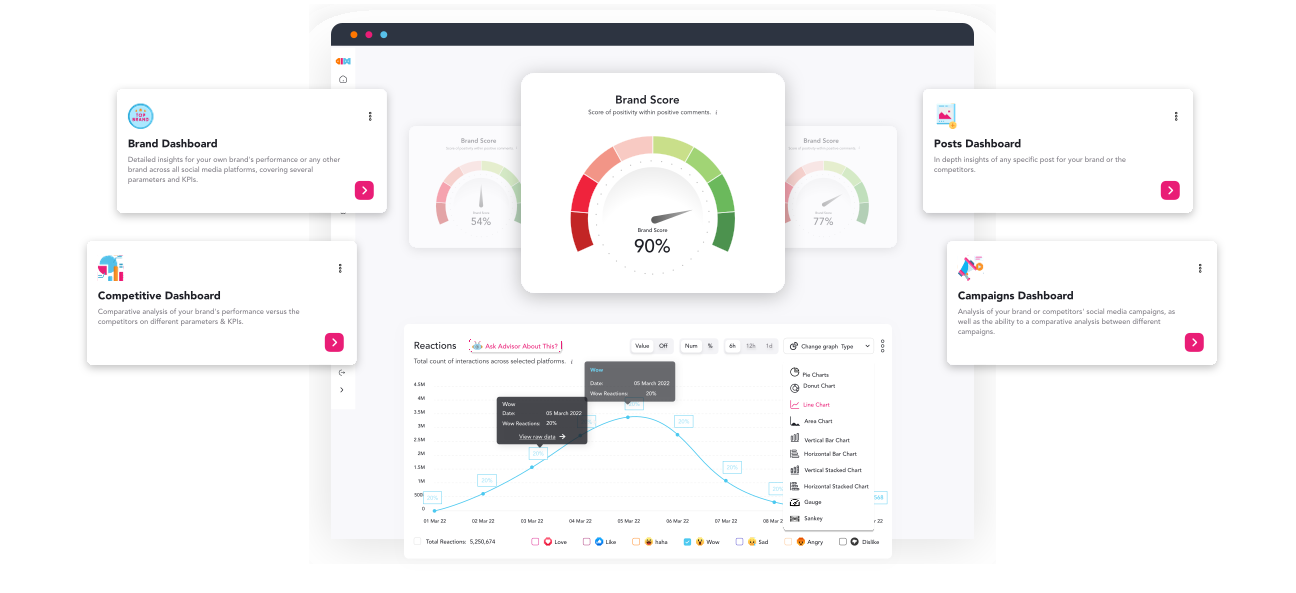
Brand Dashboard
Closely analyze your brand’s digital performance over the last 12 hours, day, week, or month.
Interpret brand interactions in 8 different languages including 12 different Arabic dialects.
Determine your brand’s virality and how much of it is earned and owned.
Assign a net sentiment score to your brand and discover how much of your audience advocates your brand, and how many don’t.

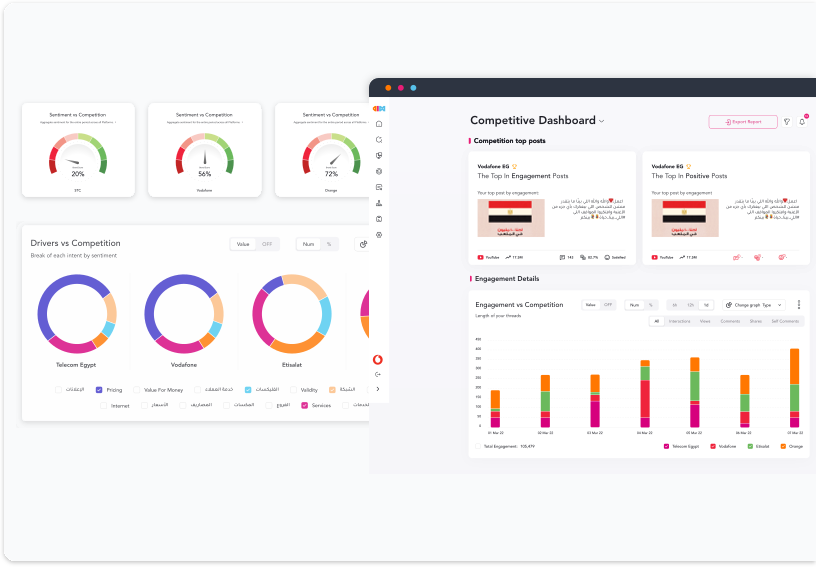
Competitive Dashboard
Monitor your competition’s digital presence, and what sets them apart from your own.
Identify which content yields the highest engagement for your rivals and what drove customers to interact with it.
Know which topics are the most engaging and highly talked about among your audiences; from highest to lowest.
Assess the sentiment within their brand interactions and categorize them to positive, negative, or neutral.
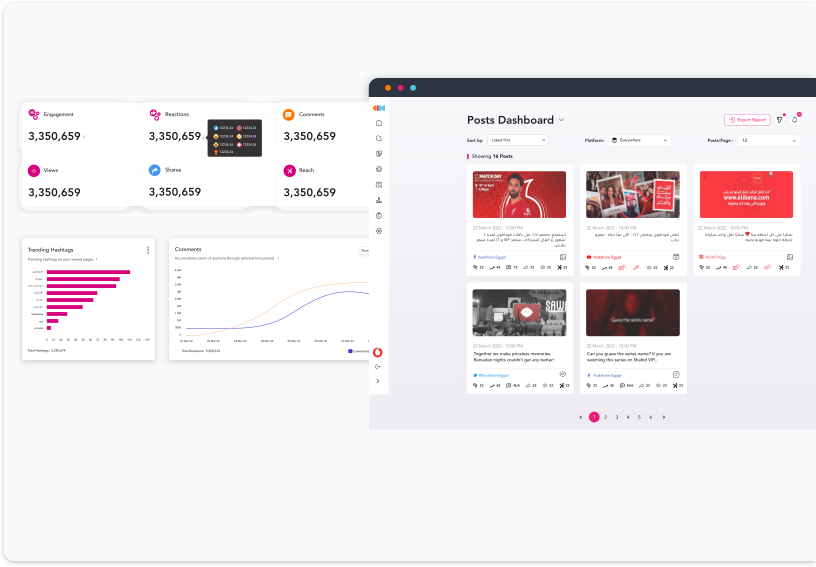
Posts Dashboard
Attain brand insights according to your hourly, daily, weekly, or monthly posts.
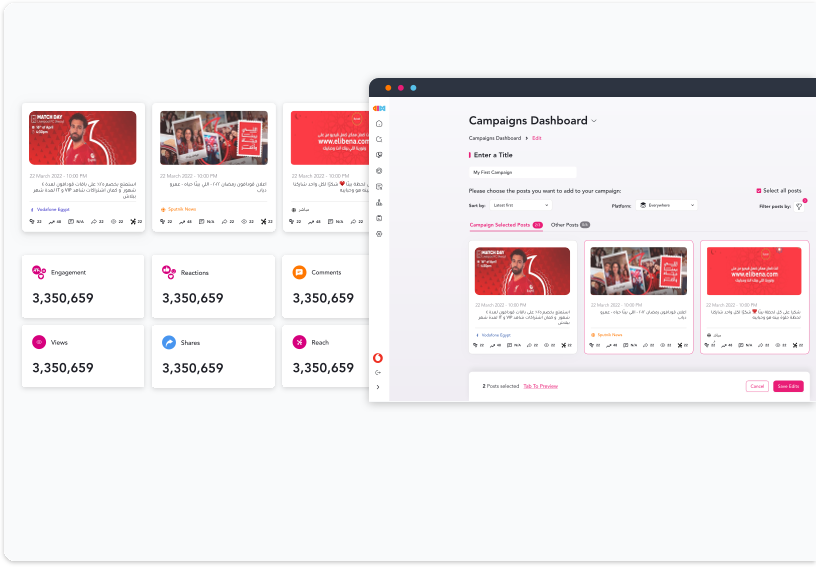
Create individual campaign groups to monitor each project’s multi-platform performance.
Edit, remove, or add posts within a campaign at any given time.
Sort your posts based on the highest reach, views, shares, comments, engagements, and overall interactions.
Campaigns Dashboard
Manage and monitor multiple marketing campaigns in one place.
Displays key performance metrics such as impressions, clicks, conversions, engagement rates, and cost per acquisition (CPA).
Analyze the historical performance of past campaigns, identifying trends, patterns, and successful strategies that can be replicated or improved upon in future campaigns.
Track campaign budgets and expenditures, providing a clear overview of spending.
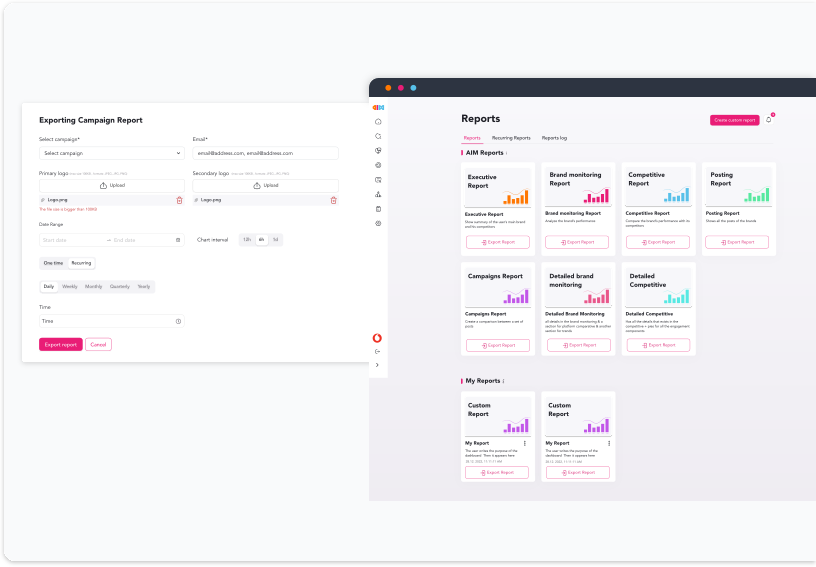
Reports
Generate sentiment analysis reports, showcasing the overall sentiment distribution and sentiment trends associated with the brand.
Export reports in various formats (such as PDF or CSV) and share them with stakeholders, facilitating collaboration, presentations, and further analysis.
Schedule automated report generation, saving time and effort by receiving regular reports directly in their inbox or accessing them through the tool's dashboard.
Customize Dashboard
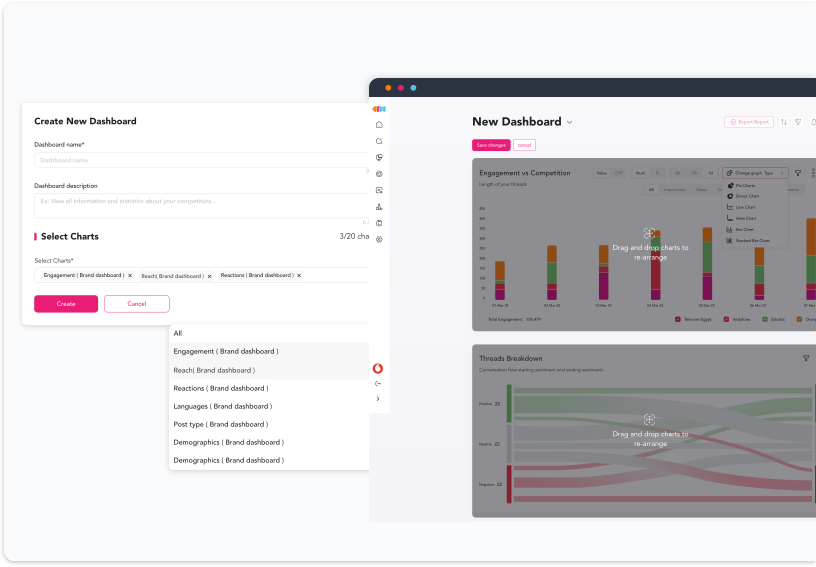
Customize the layout by adding, removing, and rearranging widgets based on their preferences and needs.
Choose from a variety of visualization options such as charts, graphs, tables, or maps to present their data in a visually appealing and easy-to-understand format.
Select and display specific metrics and key performance indicators (KPIs) that are relevant to their business objectives and goals.
Key Features
Exploring The Powerful Capabilities
Tracking and analyzing the emotional tone and sentiment expressed in social media conversations.
Identify relevant topics, gain insights into driving discussions, understand influential factors, and provide a comprehensive view of the conversations surrounding a specific keyword.
Understanding the underlying motivations and objectives behind social media posts and online discussions.
Analyzing and categorizing different aspects of user engagement, such as likes, comments, and shares
Situs Slot Gacor Hari Ini: Tempat Paling Gampang Buat Menang Maxwin!
Halo para penggemar slot online! Lagi cari tempat main slot yang gacor abis dan gampang banget buat menang? Tenang aja, slotmaxwin bakal jadi panduan lengkap kamu buat dapetin pengalaman main slot yang seru, gampang menang, dan tentunya bikin dompet makin tebal. Dengan modal kecil mulai dari 10 ribu aja, kamu udah bisa coba berbagai permainan api2000 terbaik dari provider terkenal kayak Pragmatic Play, PGSoft, dan Slot88. Yuk, kita bahas lebih dalam kenapa platform ini wajib banget kamu cobain!
Kenapa Harus Pilih Situs Slot Gacor Ini?
Banyak banget situs slot di luar sana, tapi nggak semuanya bisa kasih pengalaman yang worth it. Nah, ini dia alasan kenapa situs haha788.top beda dari yang lain dan cocok banget buat kamu:
1. RTP Tinggi Bikin Peluang Menang Besar
- Semua permainan slot di teh4d.link punya RTP live yang tinggi, sampai 98%!
- RTP dewi5000 tinggi itu artinya peluang menang kamu makin besar, jadi nggak cuma main buat seru-seruan aja, tapi juga bisa dapet cuan serius.
- Slot gacor kayak gini bikin setiap putaran terasa lebih fair dan nggak bikin rugi.
2. Modal Kecil, Potensi Menang Maksimal
- Cuma dengan deposit minimal 10 ribu, kamu udah bisa coba main di xxtoto.link.
- Situs ggtoto.top cocok banget buat yang baru mau coba-coba atau lagi cari hiburan murah meriah tapi hasilnya bisa gede.
- Meskipun modal kecil, jackpot yang ditawarkan tetep gede banget. Jadi, nggak ada alasan buat nggak coba, kan?
3. Provider Game Terkenal dan Terpercaya
- Platform dewi188.link kerja sama sama provider game slot paling top kayak Pragmatic Play, PGSoft, dan Slot88.
- Grafiknya keren, fitur-fiturnya seru, dan yang pasti jackpot dewi288 juga legit.
- Main di istana2000.link nggak cuma soal menang, tapi juga soal nikmatin game-game dengan kualitas premium.
4. Bonus dan Promo yang Bikin Tambah Untung
- Ada bonus new member 100% yang bikin deposit liga2000 pertama kamu jadi dobel.
- Ada juga promo harian dan mingguan di naga2000.link, termasuk cashback, biar saldo kamu nggak cepet habis.
- Dengan promo-promo slot2000, peluang kamu buat dapetin jackpot Maxwin jadi makin besar.
5. Transaksi Cepet dan Aman
- Nggak perlu khawatir soal deposit atau withdraw di aman788.top karena prosesnya cepet banget.
- Ada banyak opsi pembayaran ayo788, jadi kamu bisa pilih cara yang paling nyaman.
- Semua transaksi hao788 aman, transparan, dan pastinya nggak bikin ribet.
Fitur-Fitur Unggulan yang Bikin Betah
1. Bocoran Slot Gacor Hari Ini
Setiap hari ada rekomendasi slot btstoto.link terbaru yang performanya lagi bagus. Rekomendasi ini didasarkan pada data RTP live, pengalaman pemain lain, dan analisis dari tim ahli, jadi kamu bisa lebih pede buat pilih game mana yang mau dimainkan.
2. Koleksi Game Slot yang Super Lengkap
Nggak bakal bosen deh main di bydtoto karena ada banyak banget pilihan game dengan tema yang unik dan seru. Beberapa game populer yang wajib dicoba:
- Gates of Olympus: Game pptoto.link legendaris dengan fitur multiplier yang bisa bikin menang gede.
- Starlight Princess: Slot ligatoto.link dengan tema princess yang colorful dan payout besar.
- Mahjong Ways: Game rrtoto dengan vibe klasik tapi mekanik modern yang seru banget.
- Dan masih banyak lagi game lainnya yang dijamin nggak kalah seru.
3. Winrate Tinggi dan Jackpot Maxwin
Game-game di mcmtoto punya winrate tinggi, jadi peluang buat menang besar makin gede. Jackpot Maxwin juga sering banget keluar, terutama kalau kamu main di slot yang lagi gacor hari ini.
4. Layanan Customer Service 24/7
Ada tim customer service gghoki.top yang siap bantu kamu kapan aja, 24 jam non-stop. Mulai dari urusan deposit, withdraw, sampai pertanyaan soal game, semuanya dilayani dengan ramah dan profesional. Dengan adanya support ini, kamu bisa main dengan tenang tanpa takut ada masalah teknis.
Cara Main Slot Online yang Gampang Banget
Belum pernah main slot online sebelumnya? Tenang aja, proses daftar hahagacor gampang banget kok. Ikutin langkah-langkah ini:
- Daftar Akun: Pertama, daftar akun naga5000.cc dulu dengan isi data-data simpel kayak nama, email, dan metode pembayaran pilihan kamu. Pastikan data yang kamu masukin bener, biar nggak ribet waktu mau withdraw nanti.
- Deposit: Setelah akun roketslot aktif, tinggal deposit minimal 10 ribu aja buat mulai main. Jangan lupa klaim bonus new member biar saldo kamu jadi lebih gede.
- Pilih Game Slot Favorit: Masuk ke library game dan pilih slot surga22.top yang sesuai sama selera kamu. Kalau bingung, bisa cek rekomendasi slot gacor hari ini buat dapetin game dengan peluang menang terbaik.
- Mainkan Slotnya: Putar reel dan nikmati sensasi serunya main slot surga88. Perhatikan fitur kayak free spin, scatter, atau multiplier yang bisa bikin kemenangan kamu makin gede.
- Tarik Kemenangan: Kalau udah dapet hasil yang memuaskan, langsung aja tarik saldo ke rekening kamu. Prosesnya cepet dan gampang banget, jadi kamu nggak perlu nunggu lama.
Tips Buat Meningkatkan Peluang Menang
- Cari Slot dengan RTP Tinggi: Pilih game dewapetir33 dengan RTP di atas 96%, karena makin tinggi RTP-nya, makin besar peluang kamu buat menang.
- Atur Modal dengan Bijak: Tetapkan budget sebelum mulai main dan disiplin buat nggak melebihi batas itu. Hindari nafsu buat ngejar kekalahan, dan berhenti kalau udah menang gede.
- Manfaatin Bonus dan Promo: Selalu klaim bonus yang tersedia di link daftar slot terpercaya buat nambah saldo dan memperpanjang waktu main kamu. Cashback juga bisa jadi penyelamat kalau lagi kurang beruntung.
- Pelajari Game yang Mau Dimainkan: Mainkan versi demo dulu kalau ada, biar kamu ngerti mekanik dan fitur dari game tersebut. Ini penting banget, terutama buat game yang punya fitur kompleks.
- Ikuti Bocoran Slot Gacor: Selalu update info tentang slot gacor terbaru biar kamu tahu game mana yang lagi “panas” dan worth buat dicoba.
Determining an overall sentiment score by aggregating positive and negative sentiments collected from social media platforms
Applying specific criteria and segmentation options to refine data analysis based on factors like demographics, keywords, language, or influencers
Generating instant notifications and alerts based on predefined triggers and patterns identified, enabling prompt responses and actions